Our activities alsogenerate air emissions
includingnitrogenoxide (NOx) and sulfur
dioxide (SO
2
) from theburningof fuel
and flaring. These emissions directly
affect air quality, and theConsent to
Operate agreement inQatar requires us
to adhere to strict limits on these types
of emissions. DolphinEnergy employs
Continuous EmissionsMonitoring
Systems (CEMS) to continuously record
data onNO
x
andSO
2
emissions. Dolphin
Energy also retains a specialist analyzer
maintenance team to ensure that the raw
data collectedby theCEMS is properly
utilized toprovide valid emissions data.
In 2013DolphinEnergy engaged a
specialist consultant to review theCEMS
units' installation andoperation to
ensureCEMS installationmeetsUSEPA.
The reviewwas conductedbasedon the
USEPA 40CFRParts 60 and75. The
results of this 'gap analysis' will be used
to implement improvements in the
quality of thedata collectedby the
CEMS. Beginning in late 2014or early
2015DolphinEnergywill conduct
RATA testingof itsCEMSbasedon a
requirement in theConsent ToOperate
(CTO) permit.
In2013, DolphinEnergycompleted the
designof, andordered replacement
burners for, itshigh-pressuresteam
boilers. In2015, DolphinEnergywill begin
replacingoldburners for new inorder to
sustain its lowNO
x
emissions. This retrofit
of thepressuresteamboiler burnerswill
takeseveral years tocomplete, since the
onlyopportunity toconduct thework is
during theannualmaintenanceworkwhen
part of theplant isshutdown.
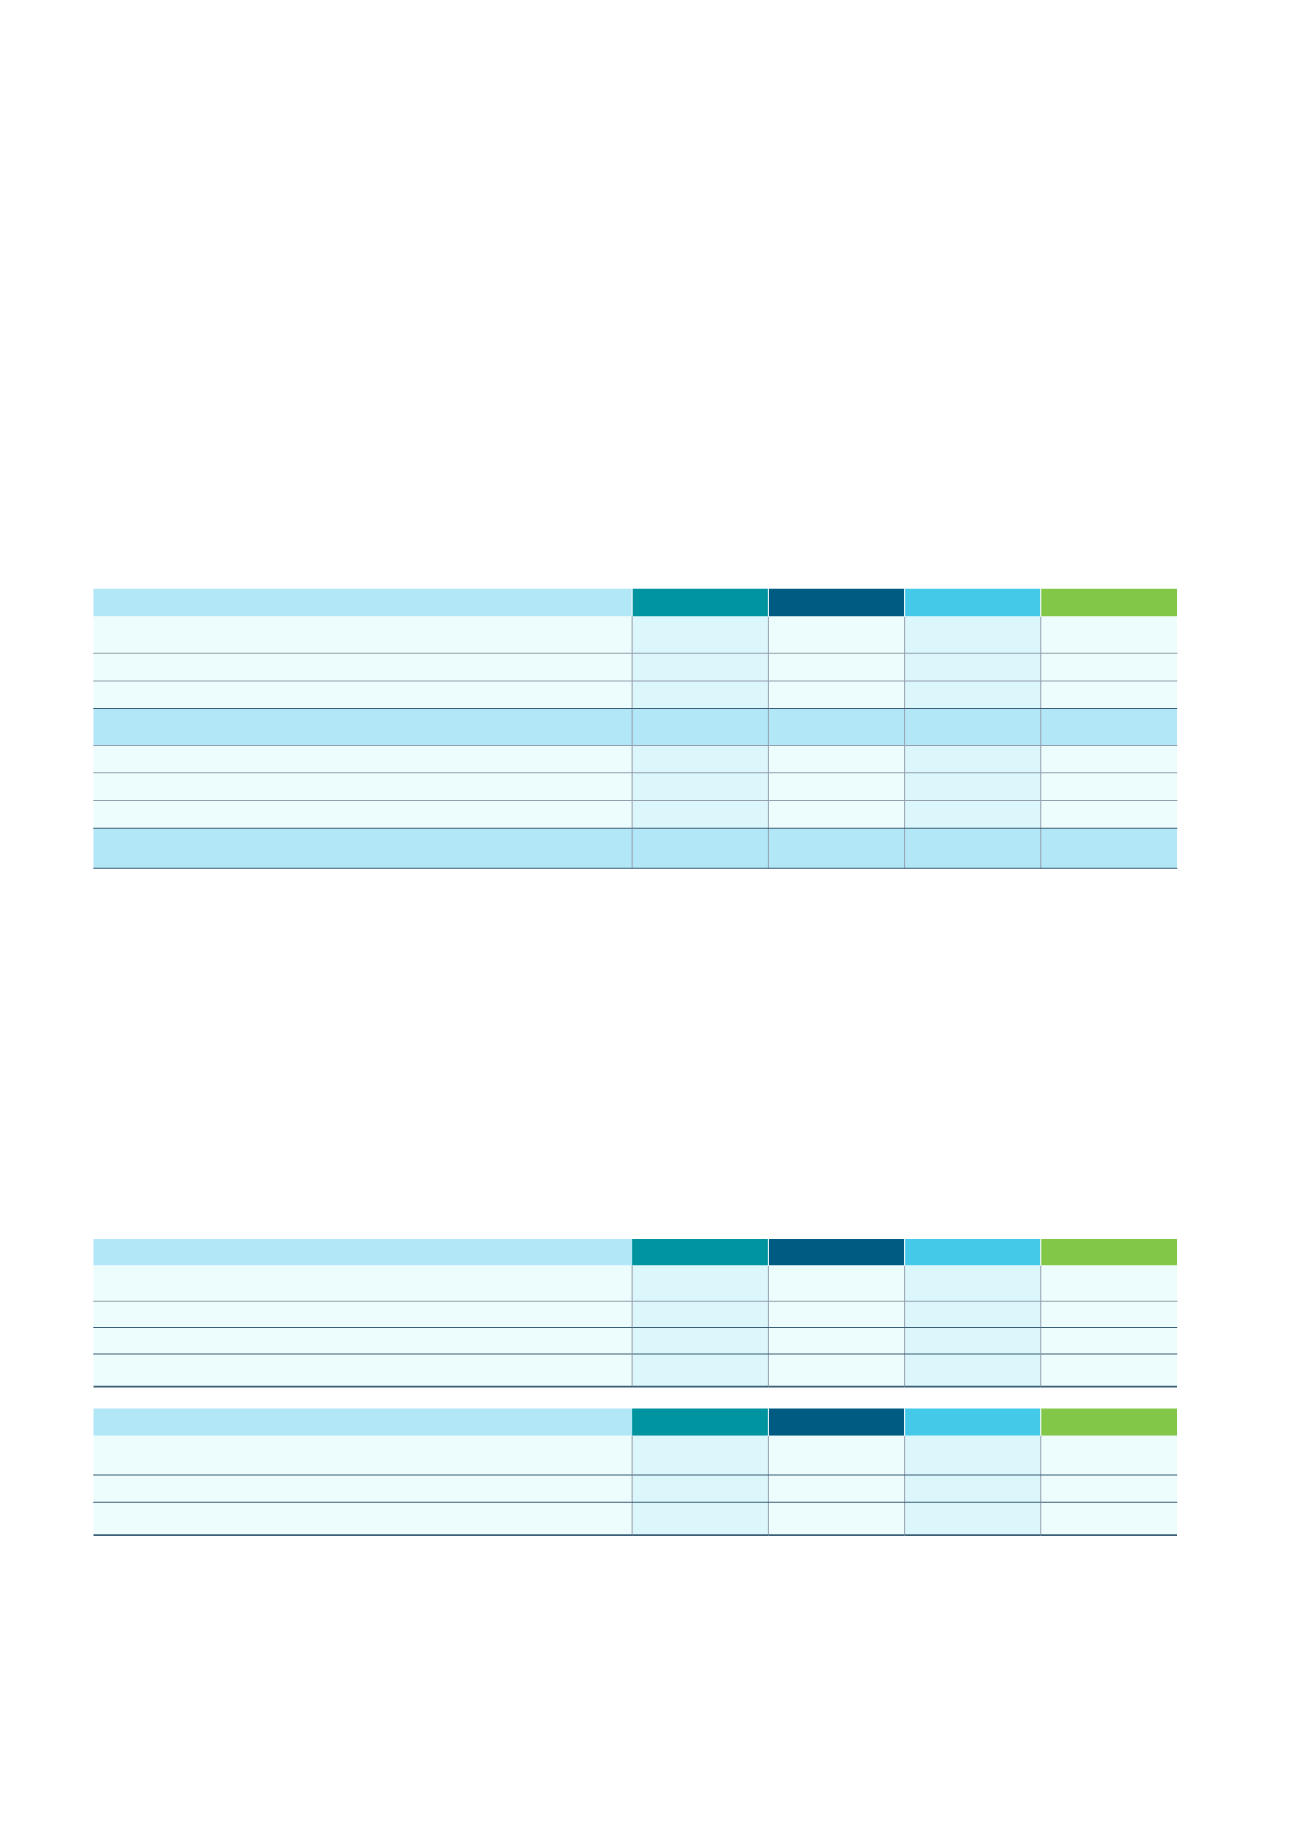
Overall, total reported emissions
to air in 2013decreasedby 12%
compared to2012 levels.
ReducingOurEnergyConsumption
It is our responsibility tominimize any
losses of energy through inefficiency.
Avoiding lossesmaximizes theamount of
product available for use, delivering social
andenvironmental benefits.We therefore
seek touse thebest available techniques
andpractices in all our operations to
improve our energy efficiency.
Measuring andmonitoringof energy
consumption from electricity, vehicle
fuel, process fuel combustion, flaring,
and venting are critical components of
the company’s energy profile analysis.
In2013, DolphinEnergy continued
to seek opportunities and implement
initiatives to achieve energy savings
and reductions in energy consumption.
In2012and2013, DolphinEnergyworked
withQatar Petroleum to identify feasible
energyefficiency initiativesanddevelop
an actionplan for implementation.
In 2014, DolphinEnergywill begin
to implement some of the identified
projects. In2013, DolphinEnergy also
conducted energy conservation surveys
at all of its office locations to identify
opportunities for greater conservation
of energy. Basedon the results of the
surveys, DolphinEnergywill focus on
raising awareness among employees of
energy use and conservation techniques.
Protect theEnvironment
continued
Total EnergyConsumptionGJ –KuwaitandQatar
2010
2011
2012
2013
Total Indirect EnergyConsumption
379,141
365,587
452,686
546,037
Total Direct EnergyConsumption
35,106,293 36,256,012 34,744,576
33,826,173
Total EnergyConsumption (GJ)
35,485,434 36,621,599 35,197,262 34,372,210
Energy Intensity (GJ/mmBOEProduction)
175,323
175,055
167,686
164,266
Indirect EnergyConsumptionMWh
2010
2011
2012
2013
ElectricityConsumption
(Qatar)
100,806
95,069
118,503
146,624
ElectricityConsumption
(Kuwait)
4,511
6,483
*7,243
5,053
Total ElectricityConsumption (MWh)
105,317
101,552
125,746
**151,677
* 2012data has been restatedbasedon improved calculations.
**Qatar PetroleumdirectedDolphinEnergy to receivemore electrical power from thegrid andgenerate less power at theRas Laffanplant for export
in 2012 and 2013.
Total Air Emissions
2010
2011
2012
2013
NO
x
(tons)
579
742
718
710
Qatar
572
737
714
705
Kuwait
7
5
4
5
NO
x
Intensity (tonsNO
x
/mmBOE)
2.86
3.55
3.42
3.39
SO
2
(tons)
257
244
189
92
Qatar
257
244
189
92
Kuwait
<1
<1
<1
<1
SO
2
Intensity (tonsSO
2
/mmBOE)
1.27
1.17
0.90
0.44
42


